
Dashboard Style: Watchlist Special
Published on July 12, 2021
minute read
Share:


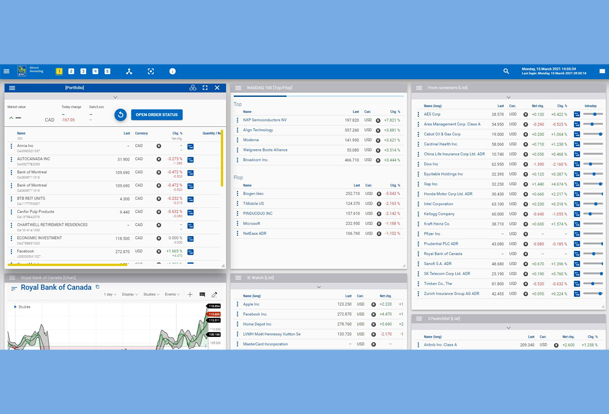
An investor using this view is not one to miss an opportunity to buy or sell — and likely has a watchlist for every occasion. Here, investors can view their portfolio and four watchlists all on one screen. There’s also a "Top/Flop" view, which shows the top performers and the “flops.”
To replicate this Dashboard example:
- Launch the Trading Dashboard from Trade & Transfer
- Select a work space from the five available across the top of the Dashboard
- Open the main menu in the top left corner of your screen
- Select “Portfolio & Lists” and choose “Portfolio”
- Choose your desired portfolio by clicking on it from the list on the right
- Size and drag the widget to the upper left side of your work space
- Return to the main menu in the top left corner of the Dashboard
- Choose “Widgets” and locate the “Top/Flop” widget, then click “Add”
- Size and drag the widget to the middle of your screen
- Use the magnifying glass to search for an index to populate the widget (the example above uses NASDAQ 100)
- Return to the main menu, select “Portfolio & Lists” and then “Watchlist”
- Choose the desired watchlist by clicking on it from the list on the right
- Size and drag the widget to the upper right side of your work space
- From the main menu, select “Widgets”, “All” and then add a “Chart” widget
- Size and drag the widget to the lower left side of your work space
- Use the magnifying glass to search for a security to populate the widget, or drag and drop a security from the watchlist or portfolio widget already opened
- For the remaining two widgets, select “Portfolio & Lists” and then “Watchlist” again from the main menu, and choose your desired watchlist from the lists on the right
- Size and drag the widgets to the lower middle and right sections
Tip: To change the type of chart displayed, use the Display dropdown menu within the chart.
Find out more about using the Dashboard in An Overview of the Trading Dashboard. For another sample setup idea, check out I SPY Options.
RBC Direct Investing Inc. and Royal Bank of Canada are separate corporate entities which are affiliated. RBC Direct Investing Inc. is a wholly owned subsidiary of Royal Bank of Canada and is a Member of the Investment Industry Regulatory Organization of Canada and the Canadian Investor Protection Fund. Royal Bank of Canada and certain of its issuers are related to RBC Direct Investing Inc. RBC Direct Investing Inc. does not provide investment advice or recommendations regarding the purchase or sale of any securities. Investors are responsible for their own investment decisions. RBC Direct Investing is a business name used by RBC Direct Investing Inc. ® / ™ Trademark(s) of Royal Bank of Canada. RBC and Royal Bank are registered trademarks of Royal Bank of Canada. Used under licence.
© Royal Bank of Canada 2021.
Images presented in the image are for illustrative purposes and may not represent the actual web pages within the RBC Direct Investing online investing site.
The views and opinions expressed in this publication are for your general interest and do not necessarily reflect the views and opinions of RBC Direct Investing. Furthermore, the products, services and securities referred to in this publication are only available in Canada and other jurisdictions where they may be legally offered for sale. If you are not currently resident of Canada, you should not access the information available on the RBC Direct Investing website.
Inspired Investor brings you personal stories, timely information and expert insights to empower your investment decisions. Visit About Us to find out more.