
What the U.S. Election Could Mean for Investors
Written by The Content Team | Published on October 21, 2020

Written by The Content Team | Published on October 21, 2020

If you're like us, you're itching to get your hands on a crystal ball to determine how things will play out in the 59th U.S. presidential election on Nov. 3 and what that will mean for investors.
We're pretty sure those elusive crystal balls don't actually exist. Next best thing? The economists and analysts at RBC Global Asset Management (RBC GAM) have been following the lead-up to the U.S. election closely, from the impacts of the pandemic to platform promises and possible economic implications.
Here we bring you highlights from some of RBC GAM's recent commentary on the U.S. election.
First up, a look at the candidates — not that they need an introduction.
Former vice president Joe Biden is the Democratic nominee contesting President Donald Trump. Biden's running mate is Senator Kamala Harris, of California, while Trump's is current vice president, Mike Pence, former governor of Indiana. The presidential candidates, not surprisingly, have very different policy visions and a change in leadership could affect economic growth in various ways.
Election Playbook
According to economists, market pundits have been quick to label Republicans, and the re-election of President Trump, as the preferred outcome from an investor's perspective. Keep in mind, that assumption — as you likely know — is largely rooted in a continued agenda that has delivered lower taxes and reduced regulations. Under a Biden presidency, that agenda would end since he's largely opposed to those measures. Thus, the most widely cited election risk centres on a Biden presidency and the potential for corporate tax hikes.
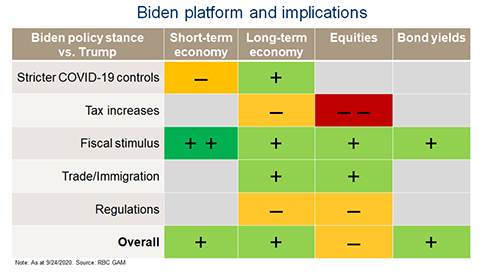
Economic Implications of a Biden Presidency
Here's how RBC GAM tees up the economic implications in the event of a change in leadership:
Should Investors Fear an "October Surprise"?
According to RBC GAM, an October surprise as far as U.S. politics are concerned relates to a startling news event in the lead-up to an election which could influence the outcome. For example, it notes, President Trump tested positive for COVID-19 early this month.
Still, RBC GAM says that while October surprises tend to dominate news cycles, history suggests they offer little concern for investors. Looking at the historical performance of the S&P 500 from October 1 to Election Day during the past 23 elections, markets were positive nearly 74 per cent of the time, with median gains of 1.6 per cent, RBC GAM notes. It adds that the only two notable downside events in the immediate lead-up to an election were in the midst of the Great Depression and global financial crisis of 2008.
Looking Back to Look Ahead: Economy & Market Reactions
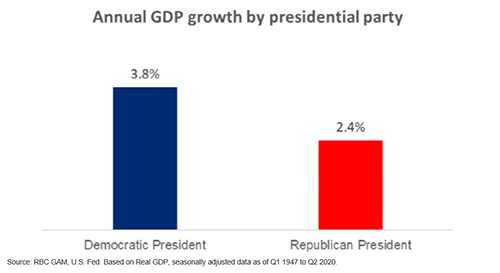
It's always interesting to look to historical data for indications of what may be on the way once the outcome of the election is known. RBC GAM analysts took a look from the perspective of U.S. economic growth under Democratic and Republican presidents of the past, as well as from the angle of annual equity returns by presidential party. Here's what they found:
U.S. economic growth, as measured by gross domestic product (GDP), has tended to grow at a faster pace under Democratic presidents – according to data dating back to 1947. Of interest, RBC GAM notes this is the case even after neutralizing the effects of the last two economic crisis – the global financial crisis and COVID-19 pandemic – which both occurred under Republican presidents.
As far as equity markets are concerned, RBC GAM found that equity markets overall have tended to fare better under Democratic presidents – according to data dating back to 1928.
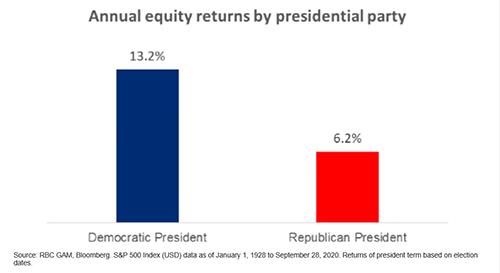
However, RBC GAM dug a little deeper to look at the implications of two terms – those of Democratic president Bill Clinton and Republican president George W. Bush.
The takeaway? If both periods are excluded from RBC GAM's calculations, average annualized returns under Democratic and Republican presidents are almost equal at 12.1 per cent and 12.2 per cent, respectively. That is to say, history does not offer a straight-cut answer on what we can expect. So with only days until the election, we'll be watching for that crystal ball! In the meantime, find out how you can stay on top of market moves, news and research in Extra, Extra: Market News is at Your Fingertips.
RBC Direct Investing Inc., RBC Global Asset Management Inc. and Royal Bank of Canada are separate corporate entities which are affiliated. RBC Direct Investing Inc. is a wholly owned subsidiary of Royal Bank of Canada and is a Member of the Investment Industry Regulatory Organization of Canada and the Canadian Investor Protection Fund. Royal Bank of Canada and certain of its issuers are related to RBC Direct Investing Inc. RBC Direct Investing Inc. does not provide investment advice or recommendations regarding the purchase or sale of any securities. Investors are responsible for their own investment decisions. RBC Direct Investing is a business name used by RBC Direct Investing Inc. ® / ™ Trademark(s) of Royal Bank of Canada. RBC and Royal Bank are registered trademarks of Royal Bank of Canada. Used under licence. © Royal Bank of Canada 2020.
The views and opinions expressed in this publication are for your general interest and do not necessarily reflect the views and opinions of RBC Direct Investing. Furthermore, the products, services and securities referred to in this publication are only available in Canada and other jurisdictions where they may be legally offered for sale. If you are not currently resident of Canada, you should not access the information available on the RBC Direct Investing website.
What the Inspired Investor team is watching
What the Inspired Investor team is watching
July ETF flows suggest buy-in to current rally and equity markets at all-time-highs