
How to Open and View an Index Fund
Published on June 9, 2021
minute read
Share:


In this article, you'll learn how to open an index fund Factsheet, view underlying assets and access the Top/Flop (gainers and losers) list for a given index.
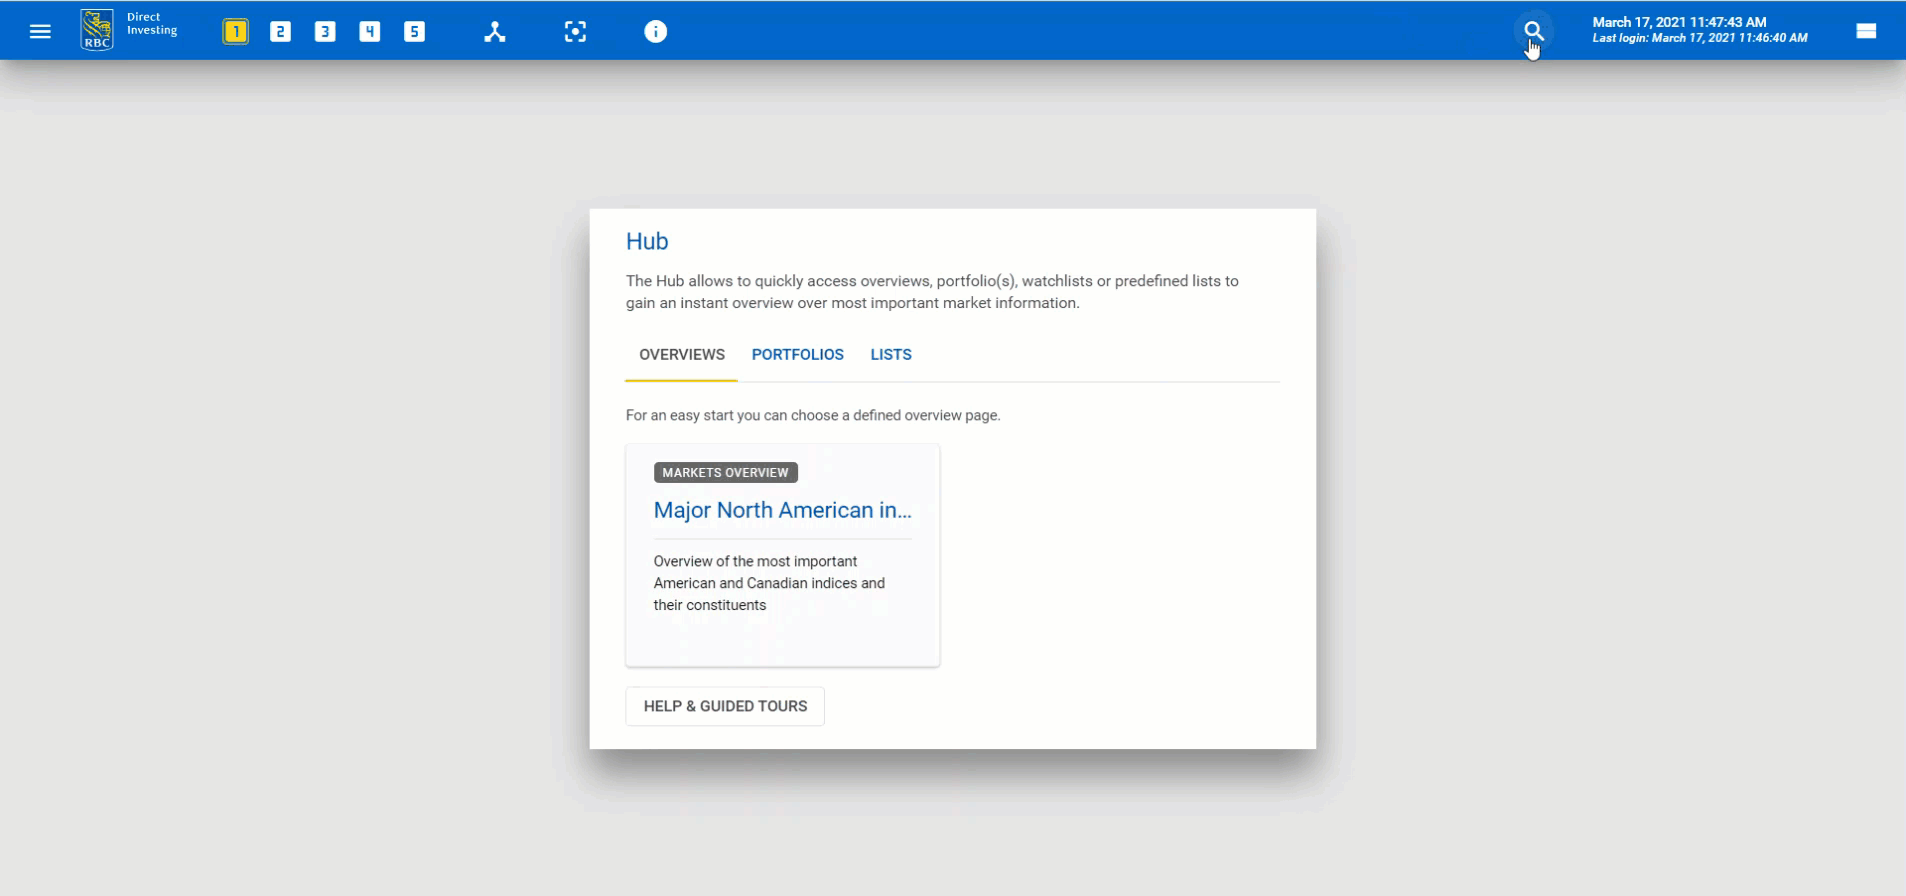
Opening an index Factsheet
To begin, let's open a Factsheet widget for the S&P 500 index in the Trading Dashboard.
First, click the search icon in the title bar and enter the name of the index.
To narrow the results or search by asset class, click the Filter dropdown menu.
Click the name of the index to open the Factsheet widget.
Alternatively, you can open the main menu, click Widgets and open an empty Factsheet widget. You can also open a Factsheet widget from another widget.
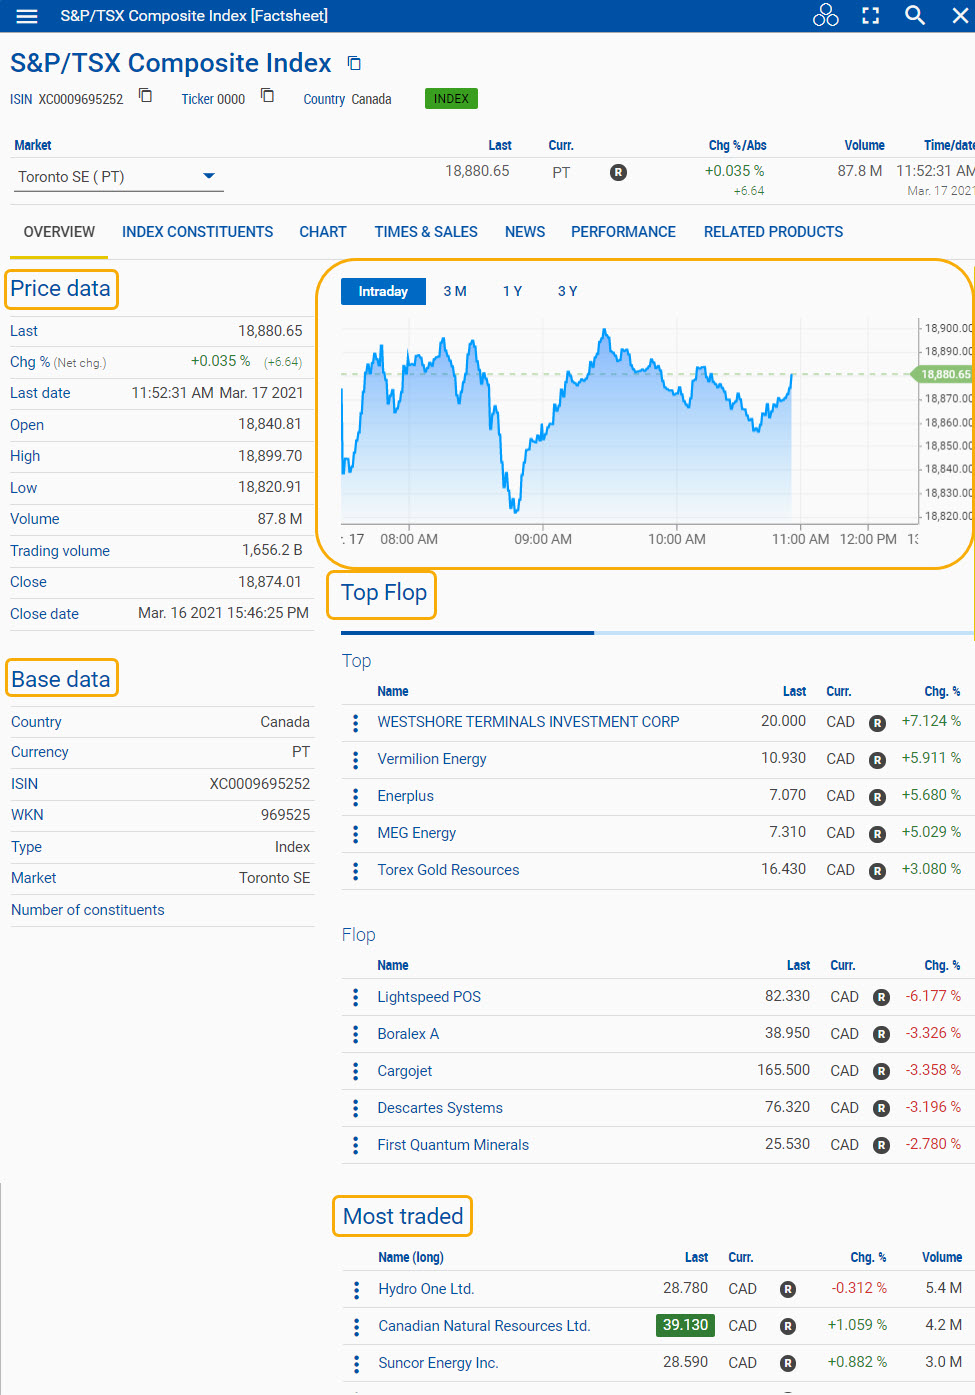
Key features of an index Factsheet widget
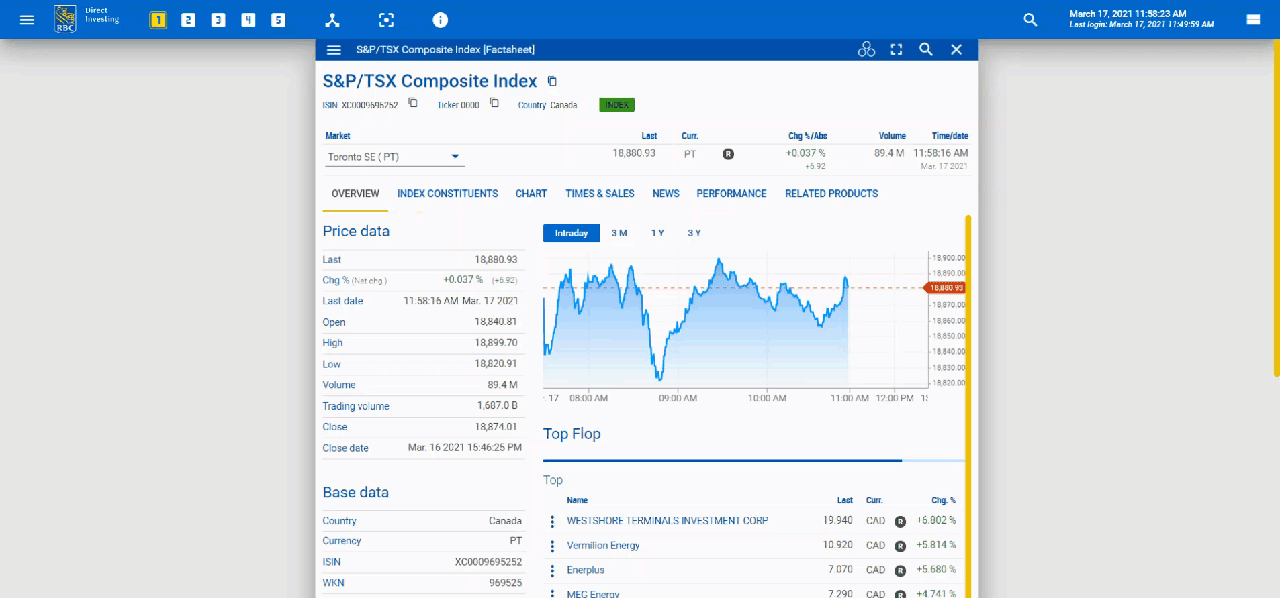
An index Factsheet widget includes an Overview tab, which shows key information about the index.
This includes
- Price Data
- Base Data
- Chart
- Top/Flop view of the gainers and losers in a given index (a separate Top/Flop widget provides more options, which we'll show later)
- Most-traded stocks
- Top/Flop and most-traded lists are calculated every minute by percentage change (Chg. %). The progress bar indicates the time until the next recalculation.
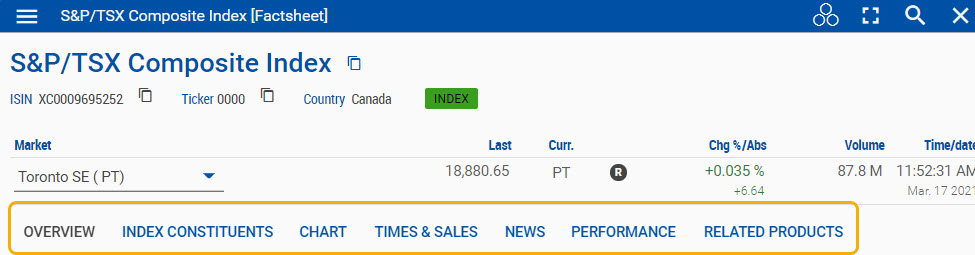
Additional tabs provide more information about the index. These include:
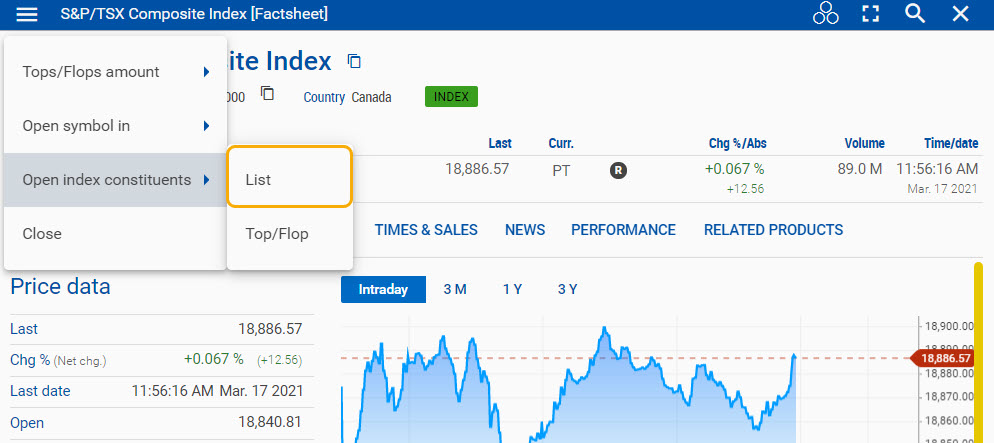
- Index Constituents tab that shows the underlying assets within an index, displayed with predefined columns (a separate Index Constituents widget provides more options – see the next section for details)
- Chart tab
- Times & Sales tab
- News tab that shows news headlines related to the index and its underlying assets
- Performance tab that shows performance data for up to five years
- Related Products tab that shows related products for the underlying index
- Options provides access to all option exchanges and option classes
- You will also find a link to Investment or Leveraged Products
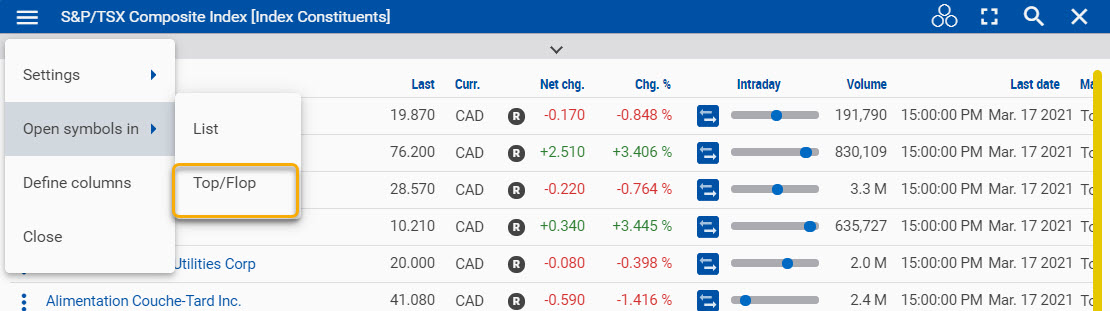
Opening the Index Constituents (underlying assets) widget
You can also open index constituents (underlying assets) in a separate widget using the widget's dropdown menu.
Alternatively, you can open an empty Index Constituents widget from the main menu.
Click Widgets and select the Index Constituents widget. Fill it by searching for an index, dragging and dropping, or broadcasting.
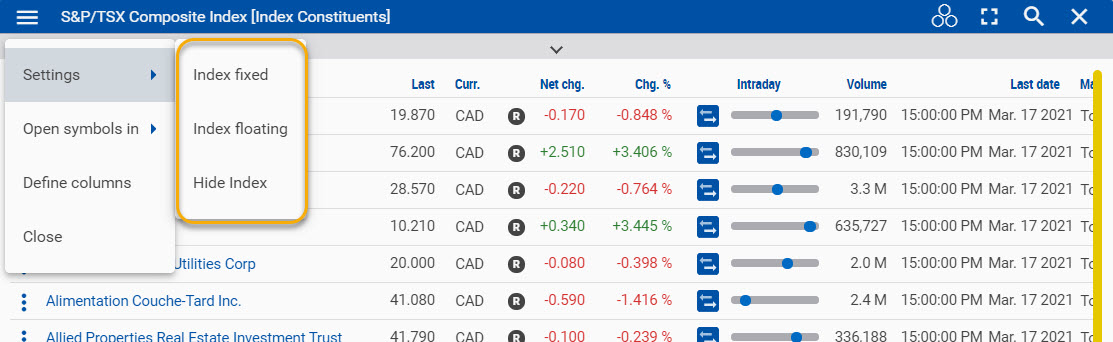
Using the dropdown menu on the widget, you can fix the index to the top of the widget, leave the index “floating" so it can be sorted into the list, or hide the index.
The Index Constituents widget also allows you to:
- Define columns, using the widget menu
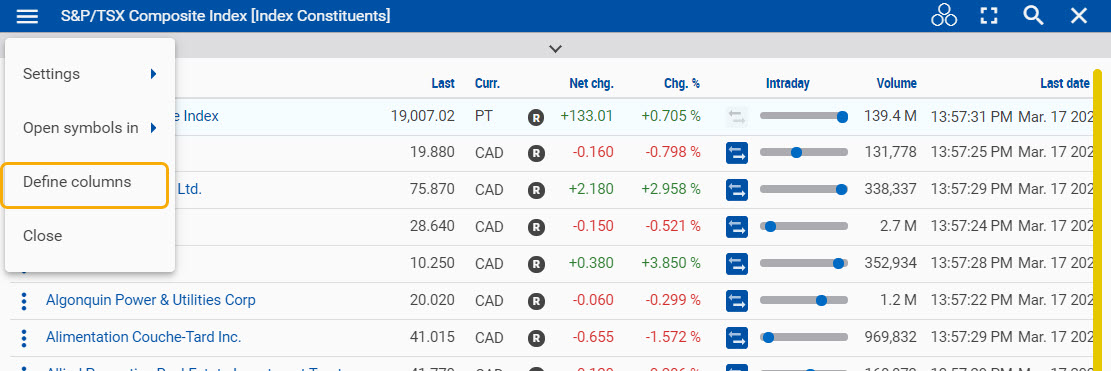
- Switch to alternative views, such as List or Top/Flop, via the list toolbar
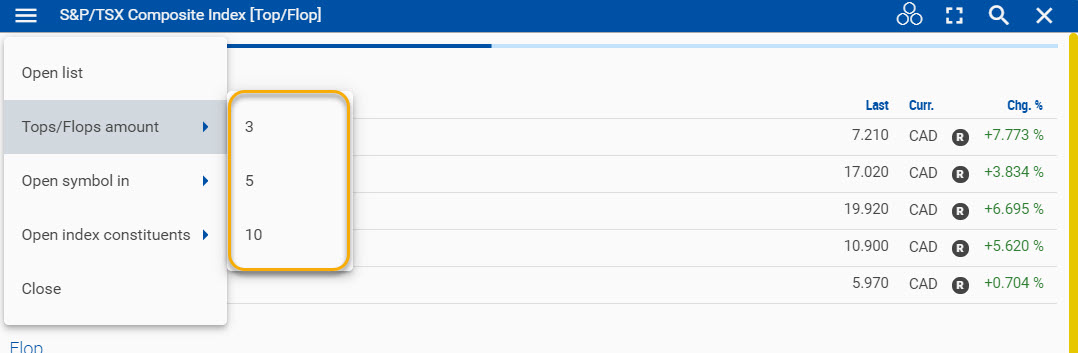
Top/Flop (gainers and losers) widget
You can open a separate Top/Flop widget for the index constituents using the widget's dropdown menu. This widget organizes the stocks by gainers and losers.
This is similar to the Top/Flop view in the index Factsheet widget, except here you can choose the number of stocks listed for gainers and losers using the widget's dropdown menu.
RBC Direct Investing Inc. and Royal Bank of Canada are separate corporate entities which are affiliated. RBC Direct Investing Inc. is a wholly owned subsidiary of Royal Bank of Canada and is a Member of the Investment Industry Regulatory Organization of Canada and the Canadian Investor Protection Fund. Royal Bank of Canada and certain of its issuers are related to RBC Direct Investing Inc. RBC Direct Investing Inc. does not provide investment advice or recommendations regarding the purchase or sale of any securities. Investors are responsible for their own investment decisions. RBC Direct Investing is a business name used by RBC Direct Investing Inc. ® / ™ Trademark(s) of Royal Bank of Canada. RBC and Royal Bank are registered trademarks of Royal Bank of Canada. Used under licence.
© Royal Bank of Canada 2021.
Images presented in the image are for illustrative purposes and may not represent the actual web pages within the RBC Direct Investing online investing site.
The views and opinions expressed in this publication are for your general interest and do not necessarily reflect the views and opinions of RBC Direct Investing. Furthermore, the products, services and securities referred to in this publication are only available in Canada and other jurisdictions where they may be legally offered for sale. If you are not currently resident of Canada, you should not access the information available on the RBC Direct Investing website.
Inspired Investor brings you personal stories, timely information and expert insights to empower your investment decisions. Visit About Us to find out more.