
How to Use Chart Widgets
Published on June 16, 2021
minute read
Share:


Here we'll show you how to use the Chart widget in the Trading Dashboard. You'll learn how to add technical indicators, drawings, events and benchmarks.
As an example, we'll analyze Royal Bank of Canada (RY) and benchmark it to other instruments in the S&P 500 index.
Chart widgets
To begin, open a Chart widget from the Widgets Gallery and add it to your workspace.
Click the search icon and enter the name of the security, in this case RY. Add it to the chart.
Alternatively, you can open a Chart widget from another widget, such as an Index Constituents widget.
The Chart widget displays the financial chart of your chosen security. You can choose from nine chart types, such as Mountain chart or Bar chart. Your selection will be the default chart type when you reopen the widget.
From the Display menu, you can select your preferred:
- Chart type, such as Candle chart
- Chart preferences, such as displaying a range selector to select a user-defined timeframe
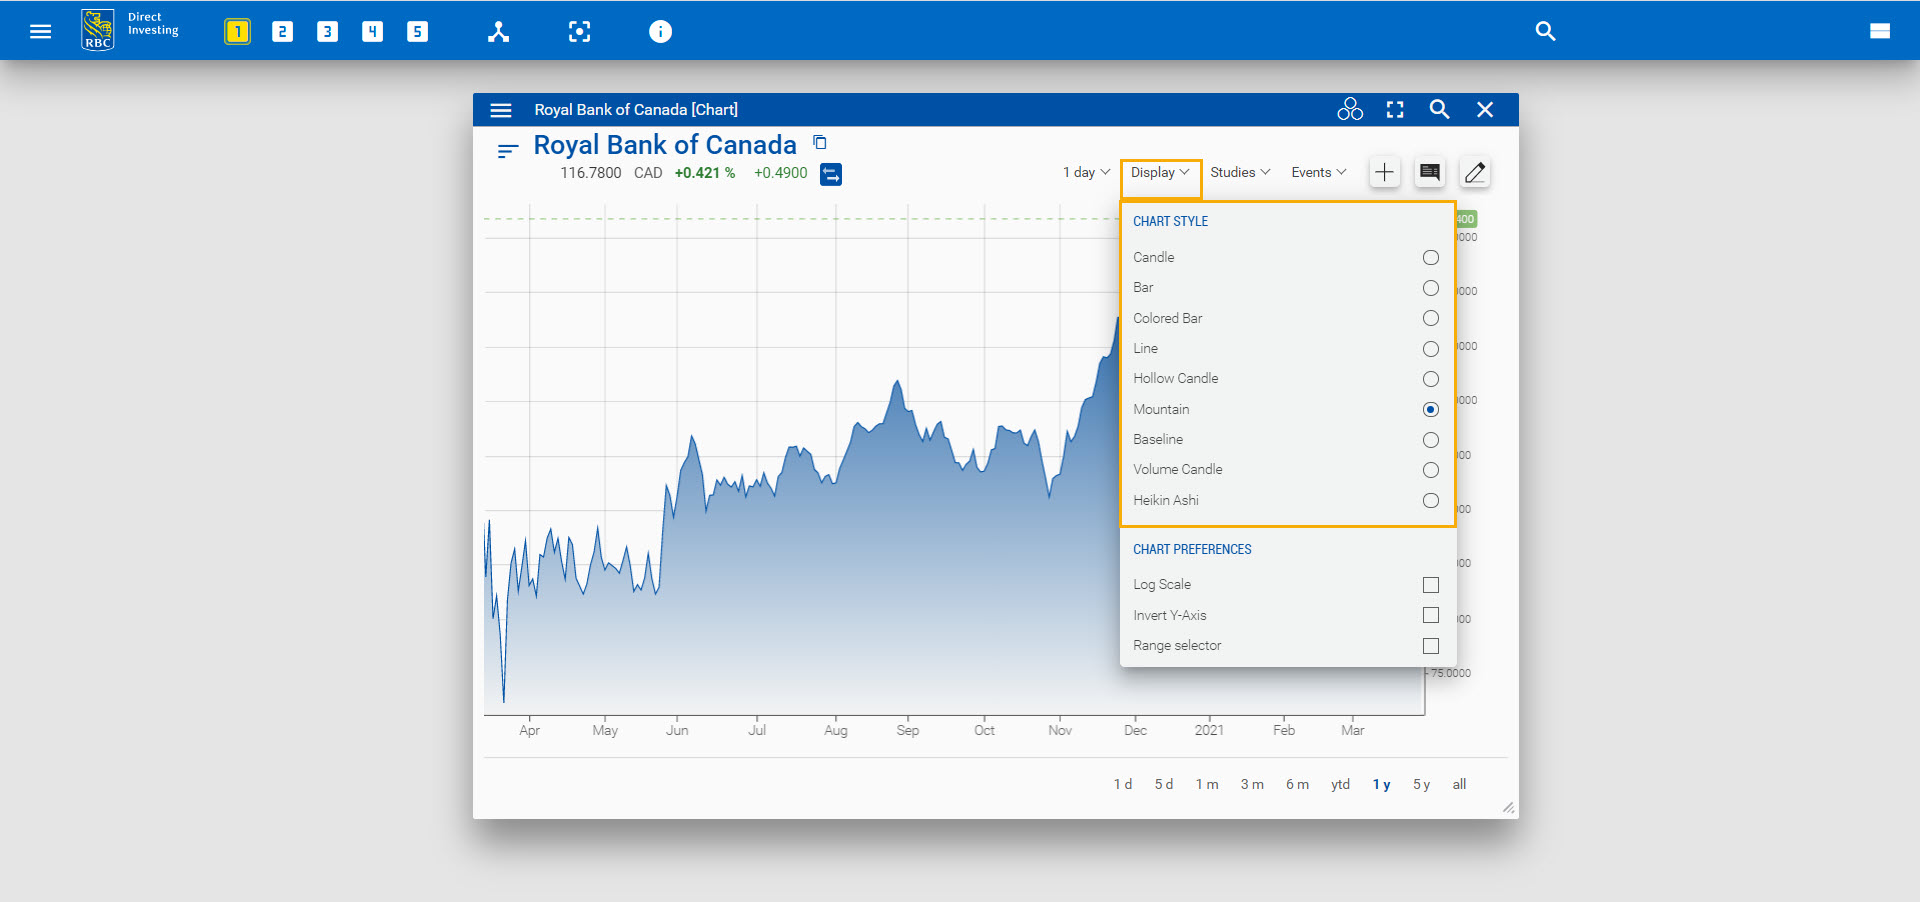
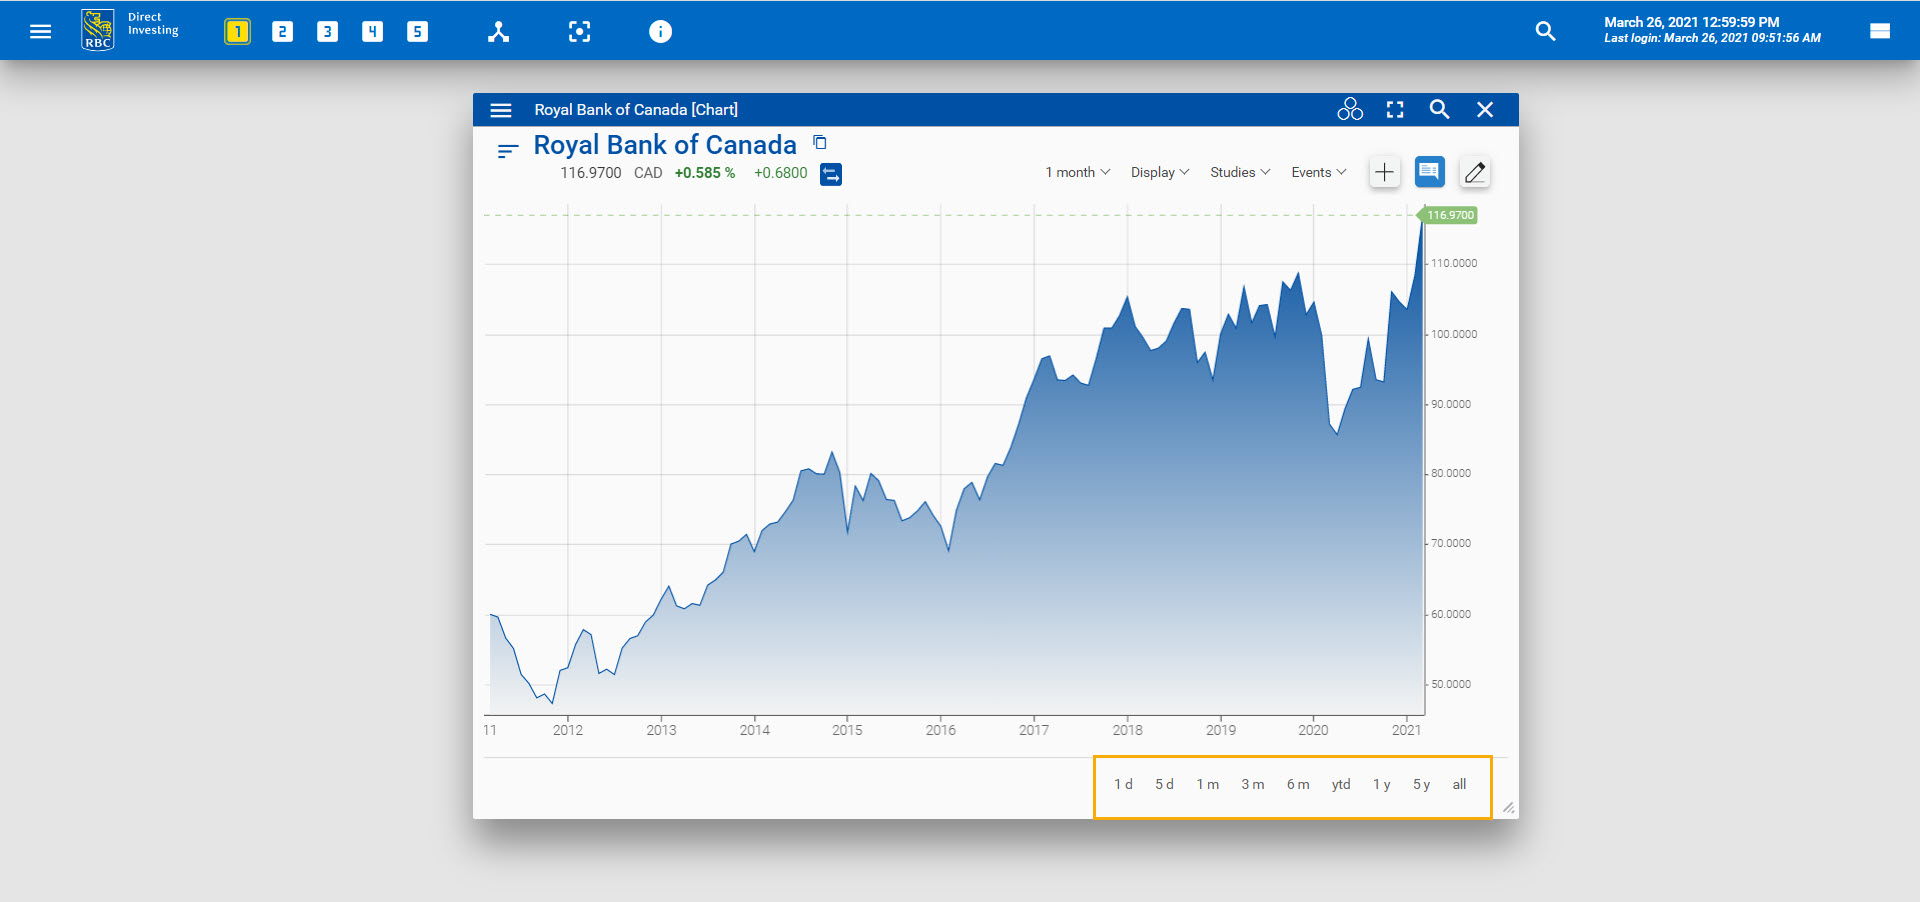
Easily navigate the chart using your mouse, touchpad or touchscreen by dragging, scrolling or using the controls.
To return the chart to its home position, click on the double arrow button.
![]()
Easily zoom in on the x- or y-axis by clicking and dragging the axis.
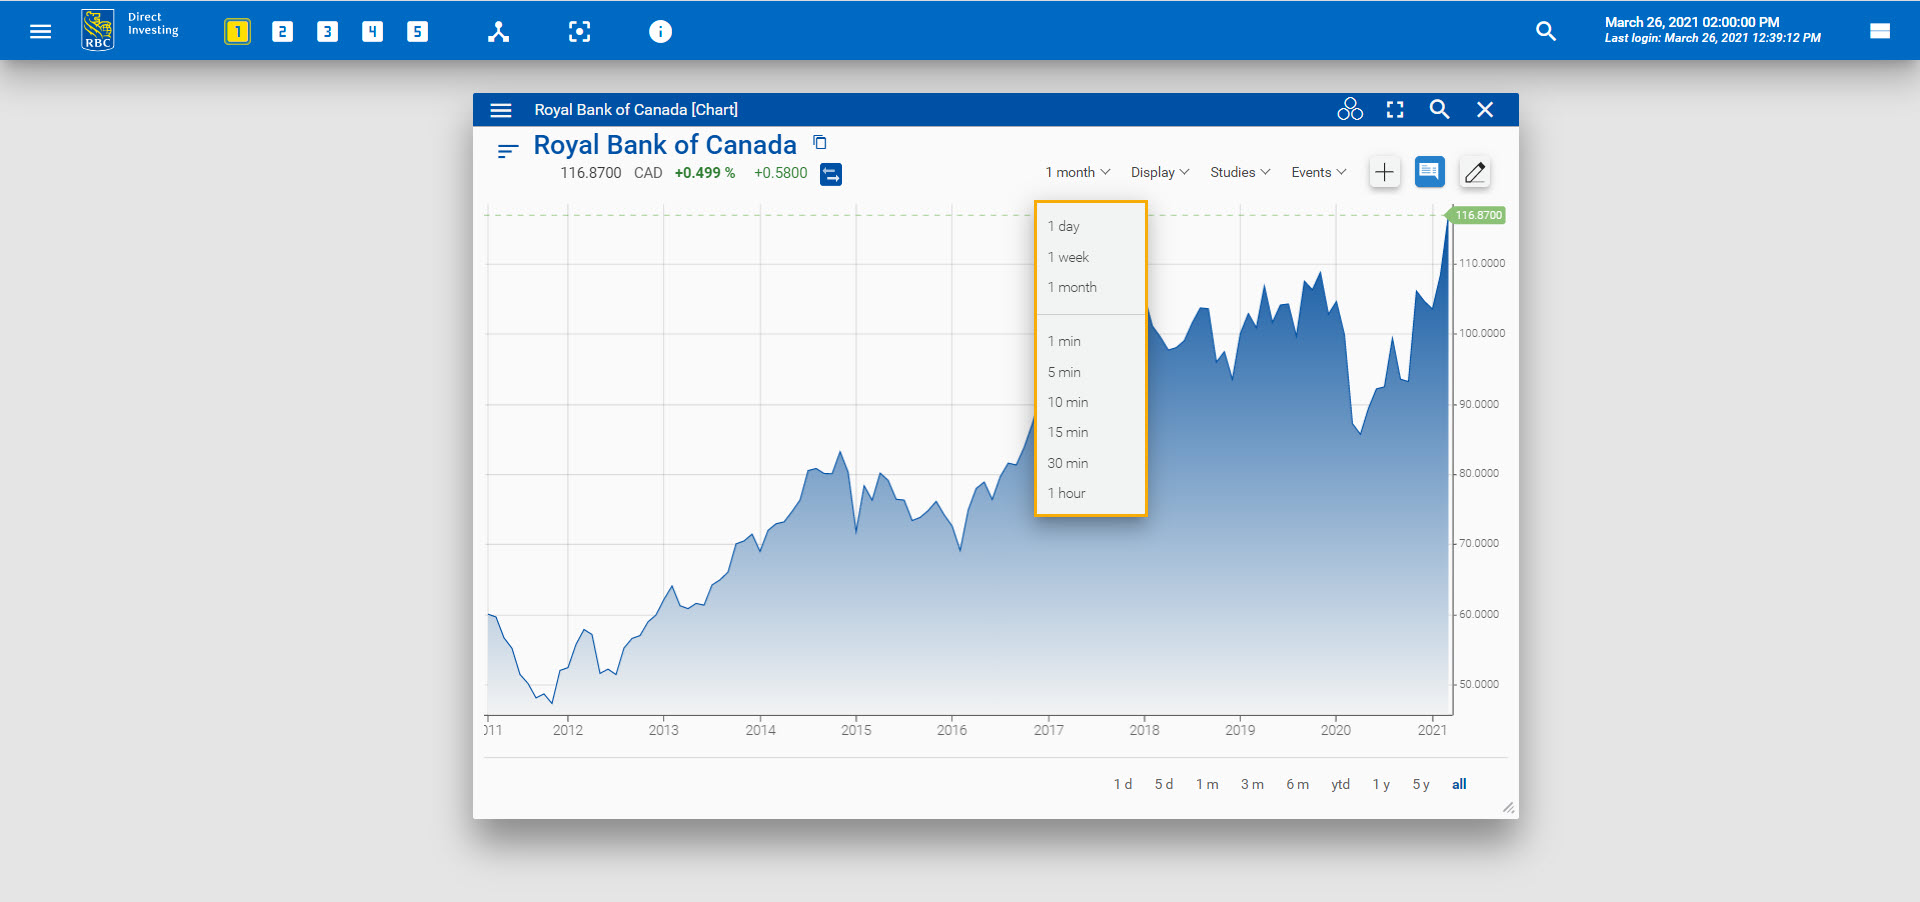
To show all historical data, change the time period at the bottom of the Chart widget from intraday to 10 years.
You can select the timeline of the data from the dropdown menu at the top. Choose from one minute to one hour for intraday charts, and daily, weekly or monthly for interday charts.
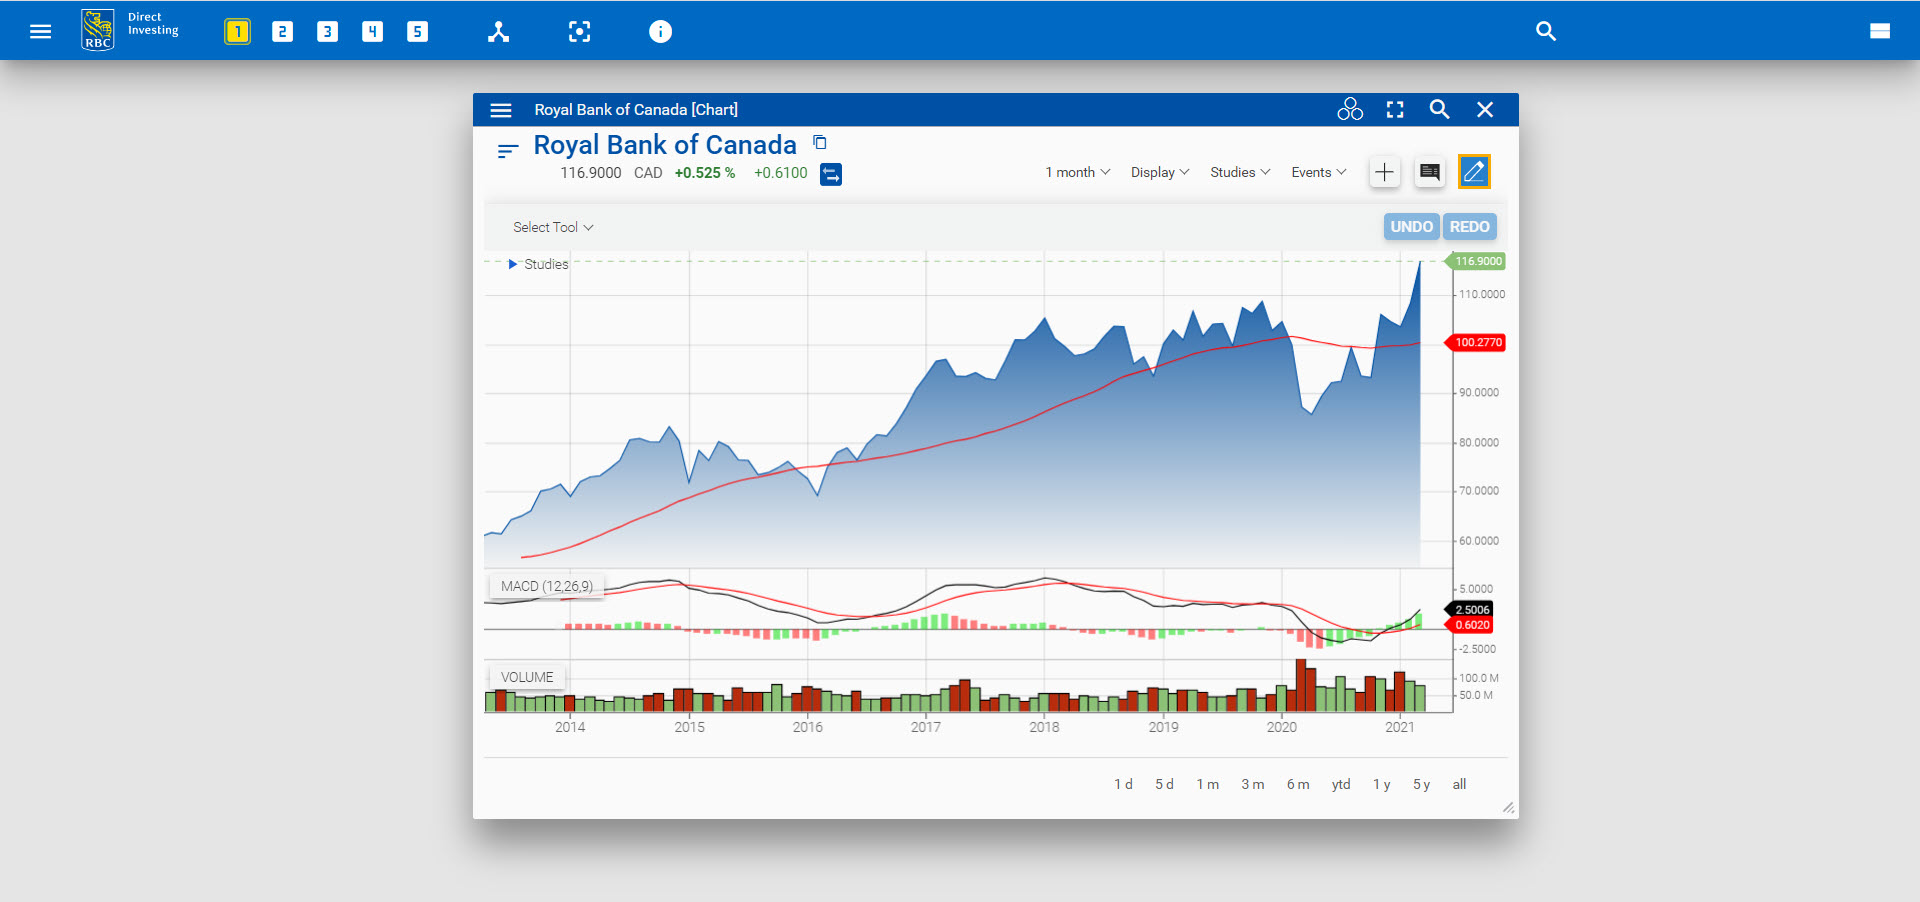
Technical indicators
The Trading Dashboard provides an extensive library of technical indicators, available in the Studies dropdown menu. In this example, we've added:
- 30-day Simple Moving Average as an overlay
- Moving Average Convergence Divergence (MACD) in a panel
- Volume Candle chart in another panel
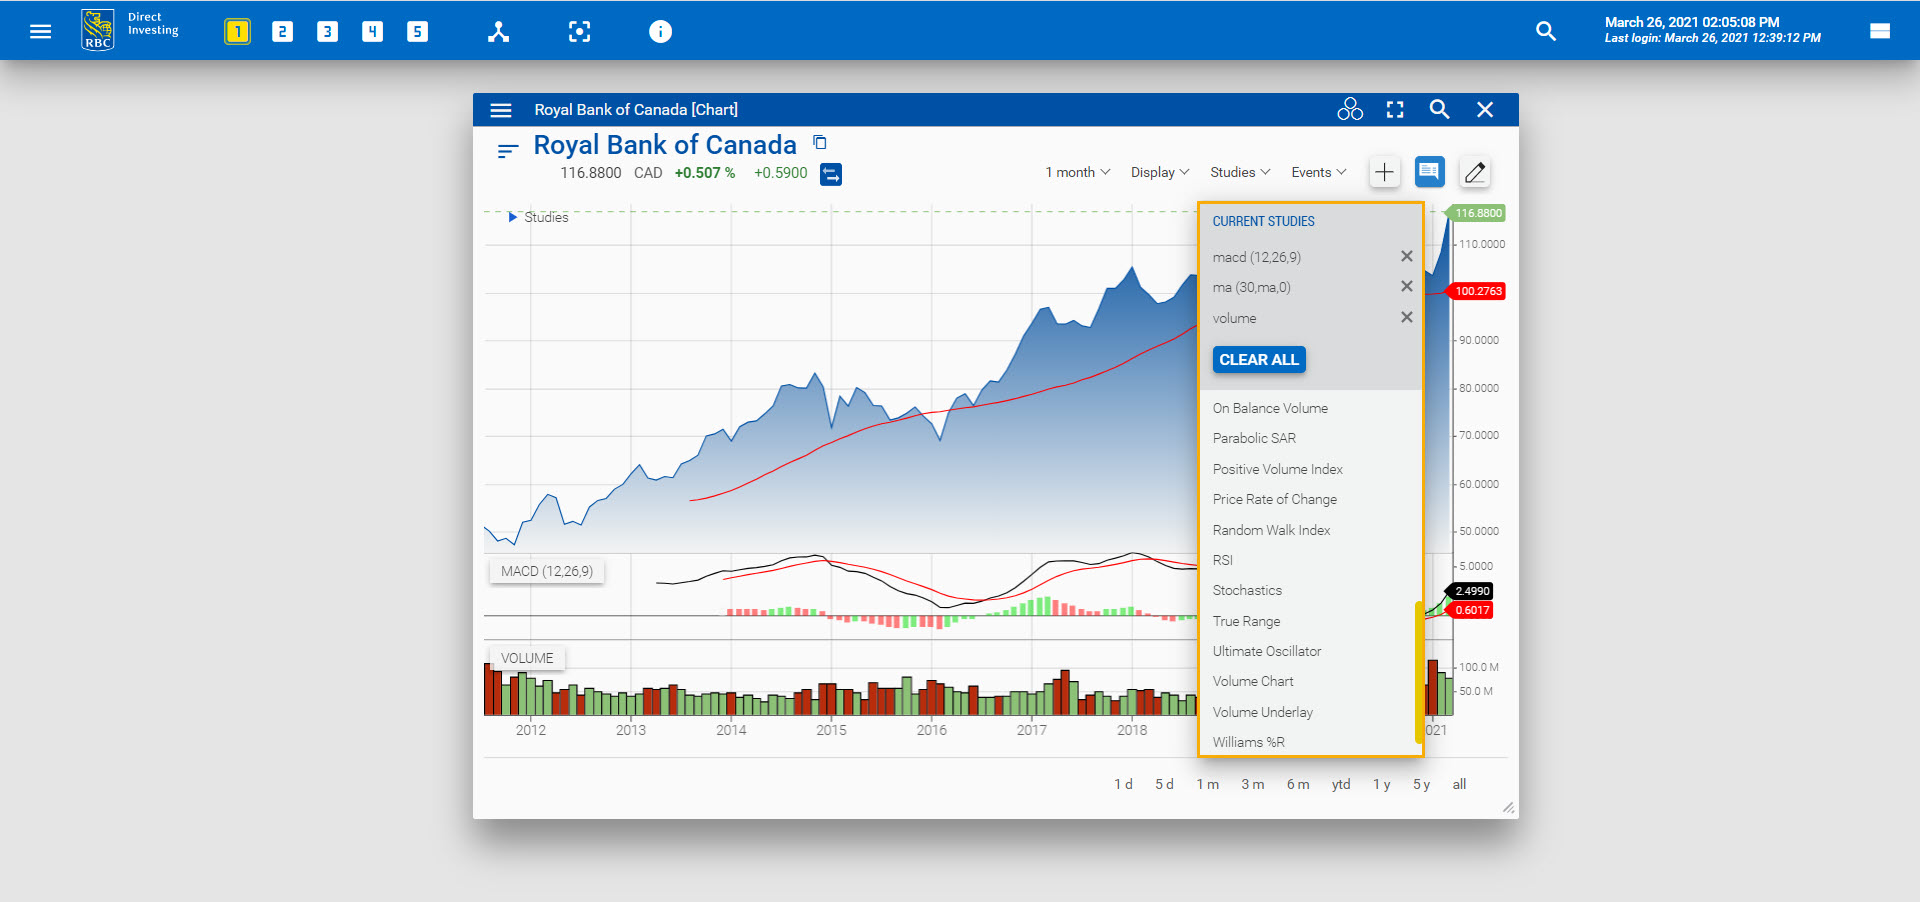
Use the arrow keys to move a panel up or down, and click and drag to adjust its height.
![]()
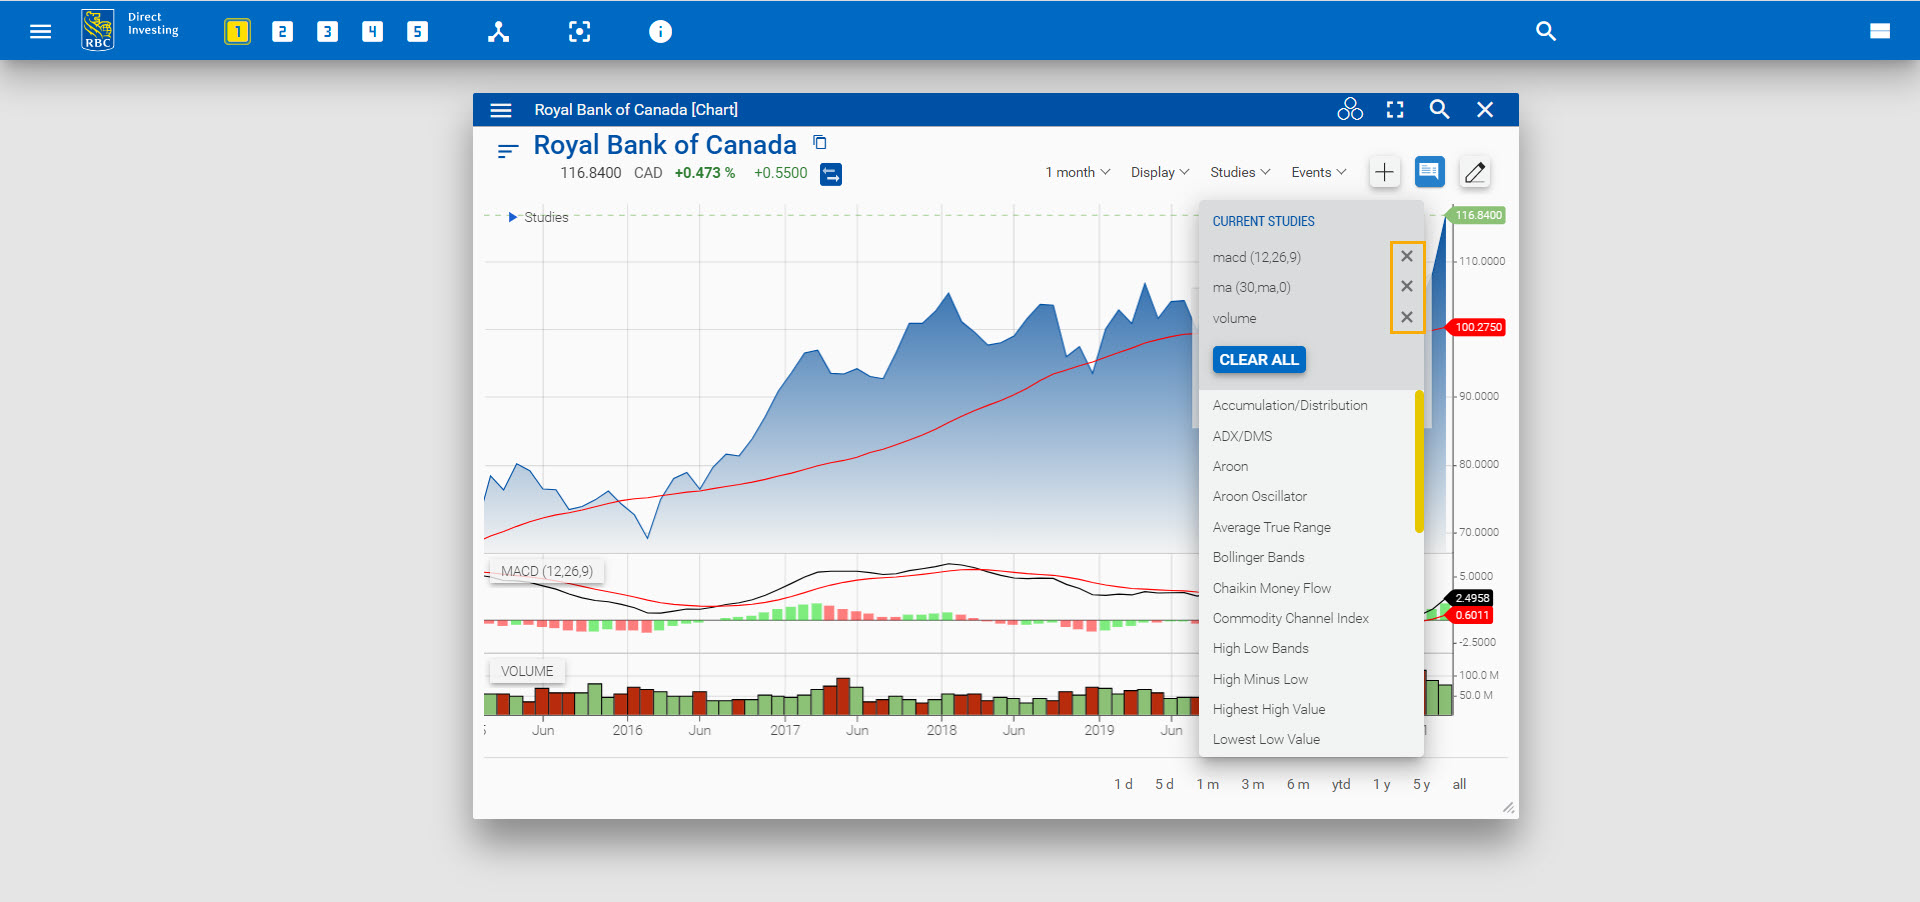
Click the cog wheel to adjust the parameters of a study.
To remove a study, click the x behind the study in the Studies menu, or hover over the study and click the x that appears.
Events
From the Events menu, you can add event flags for news headlines.
For stocks, you can also add:
- Splits
- Company events
- Dividends
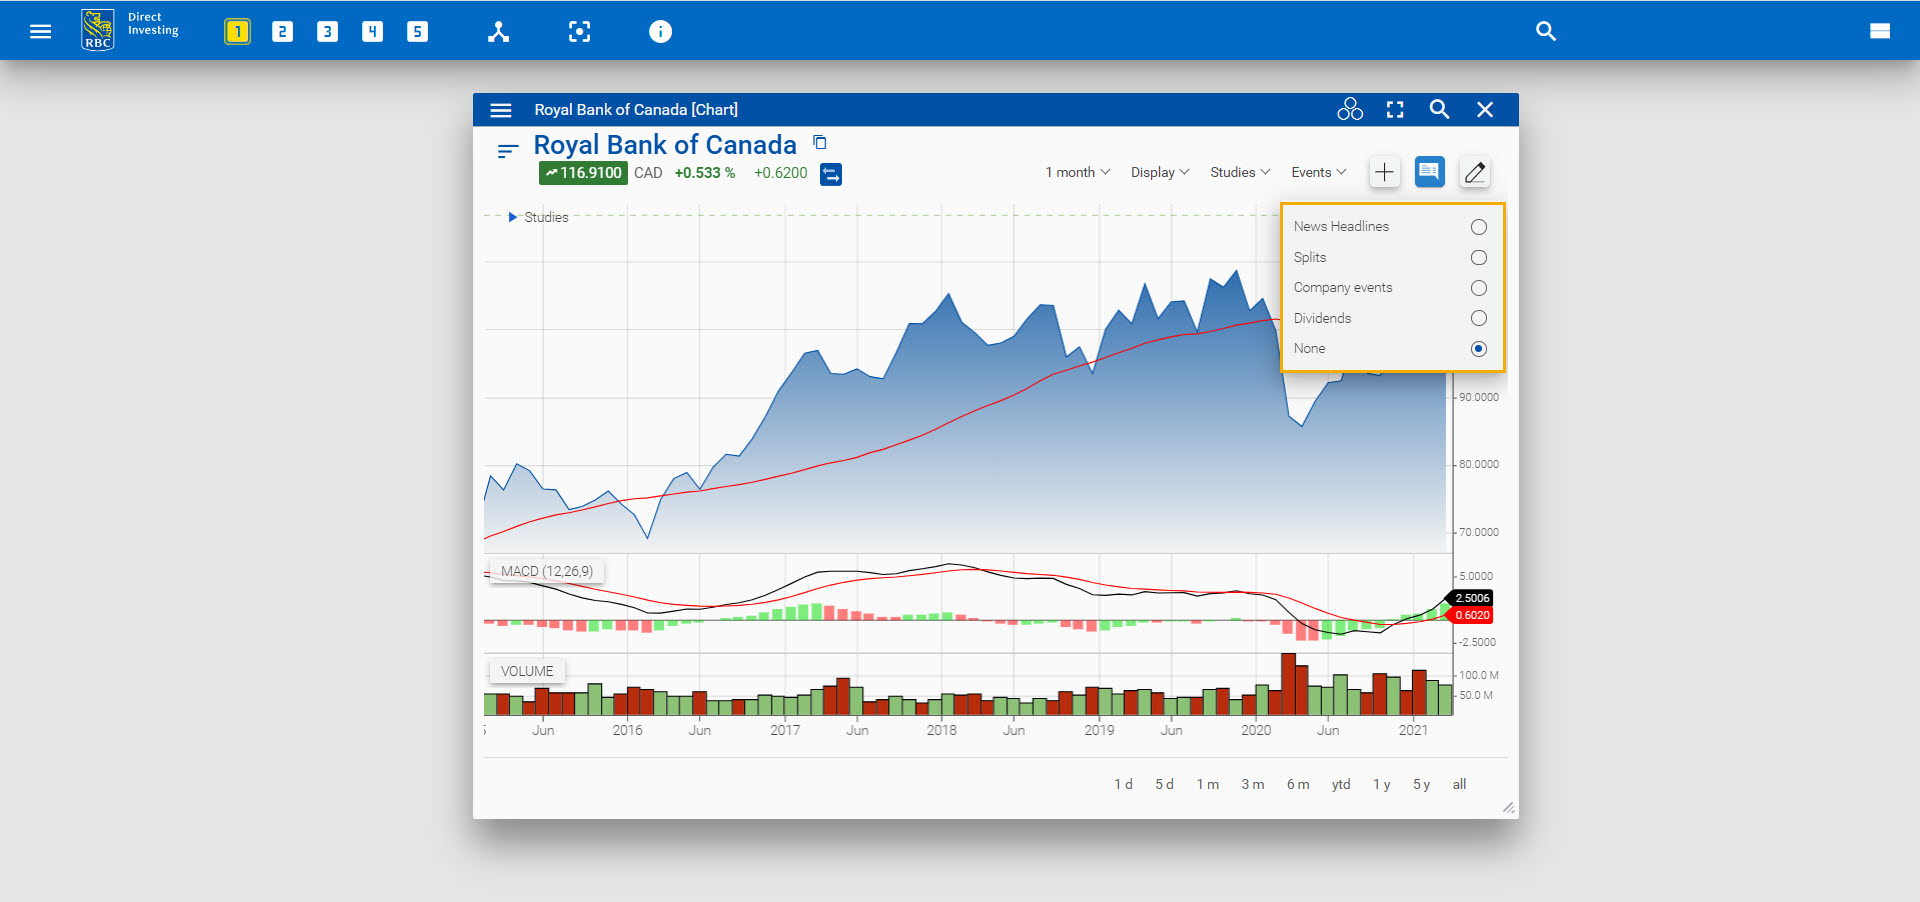
After adding news headlines, you can click an event flag for more details and launch the News widget for the corresponding story.
To remove event flags, select None from the Events dropdown menu.
Next, click the crosshair icon to show horizontal and vertical lines and inspect the data on the chart.
![]()
Drawings
To further your analysis, click the pencil icon to activate Drawing mode and add trendlines, annotations, shapes, Fibonaccis and more.
To include a drawing, select a tool from the list. Click on the chart to choose the start and end points.
To move a drawing, click and drag it. To reveal a drawing's endpoints, tap it or hover over it. To change the drawing's shape, click and drag its endpoints.
The drawing is saved with the financial instrument.
To delete a drawing, hover over it and right-click your mouse
Benchmarks
In addition to searching for a security, you can drag and drop one from another widget to replace the main instrument or add a benchmark.
Let's replace the main instrument with a security. Drag and drop the security from the S&P 500 list.
When you add an instrument to the lower part of the chart as a benchmark, such as S&P 500, a relative chart is displayed.
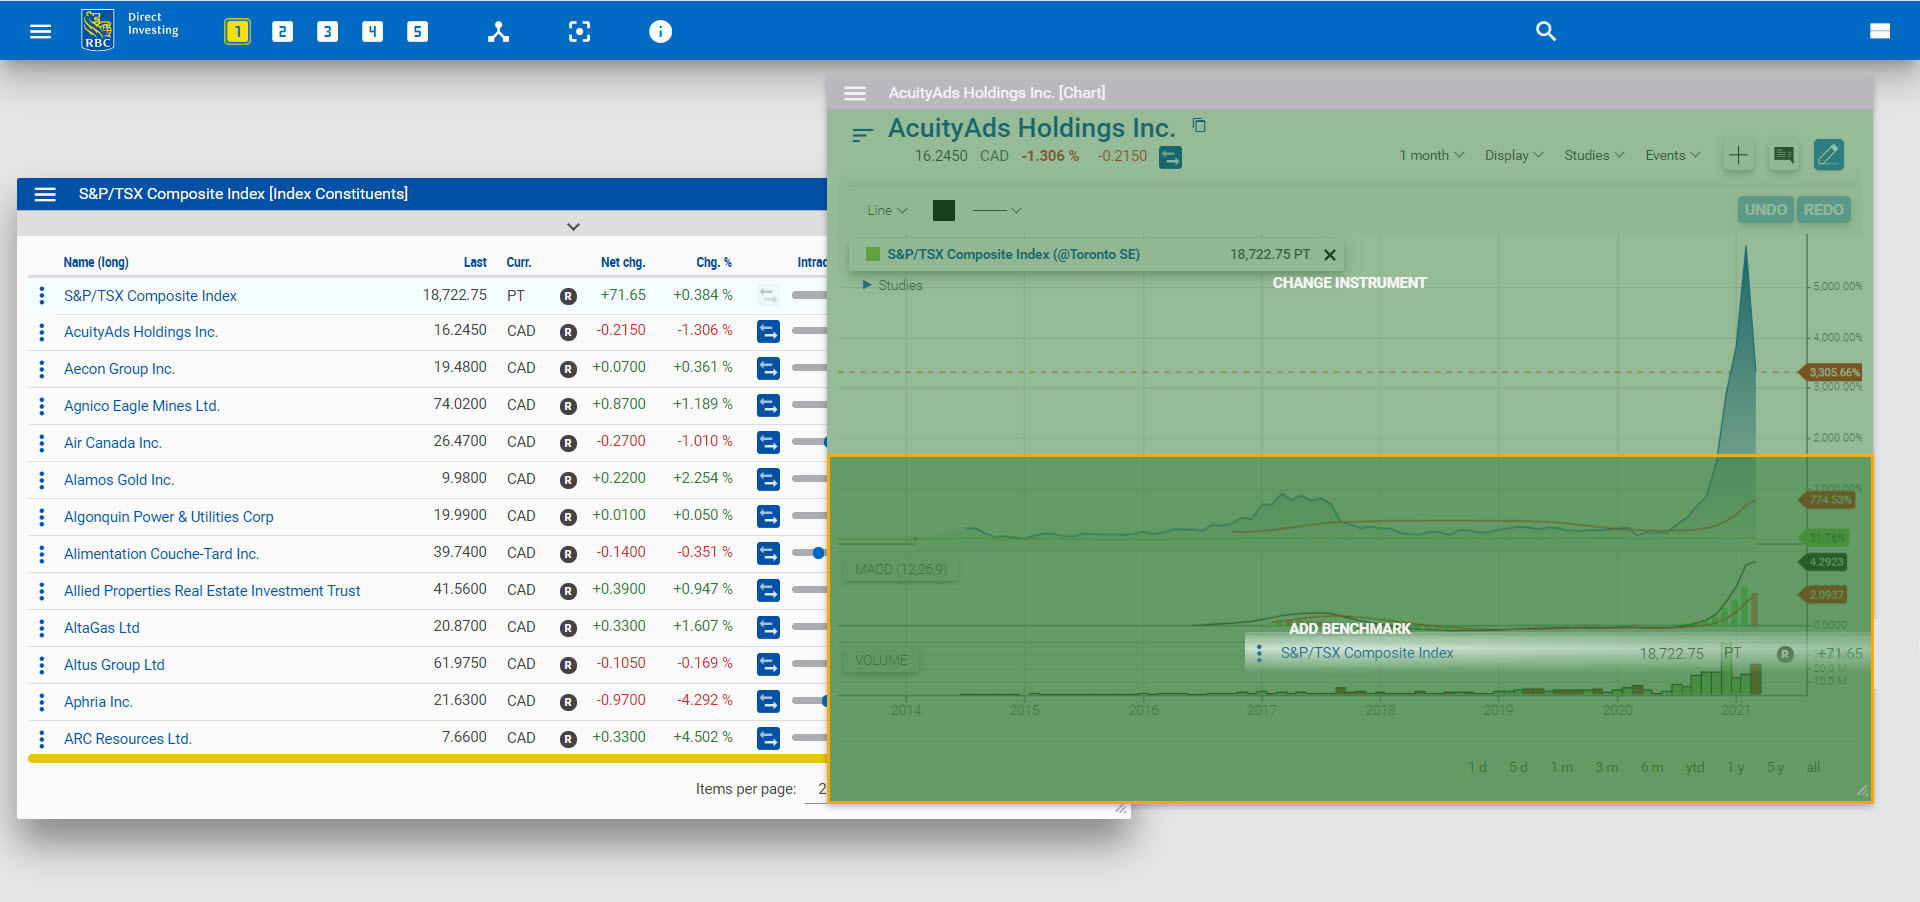
You can add up to 10 benchmarks.
For more information about a security, there is a mini quote available near the top of the widget. Click the three lines beside the company name below the title bar.
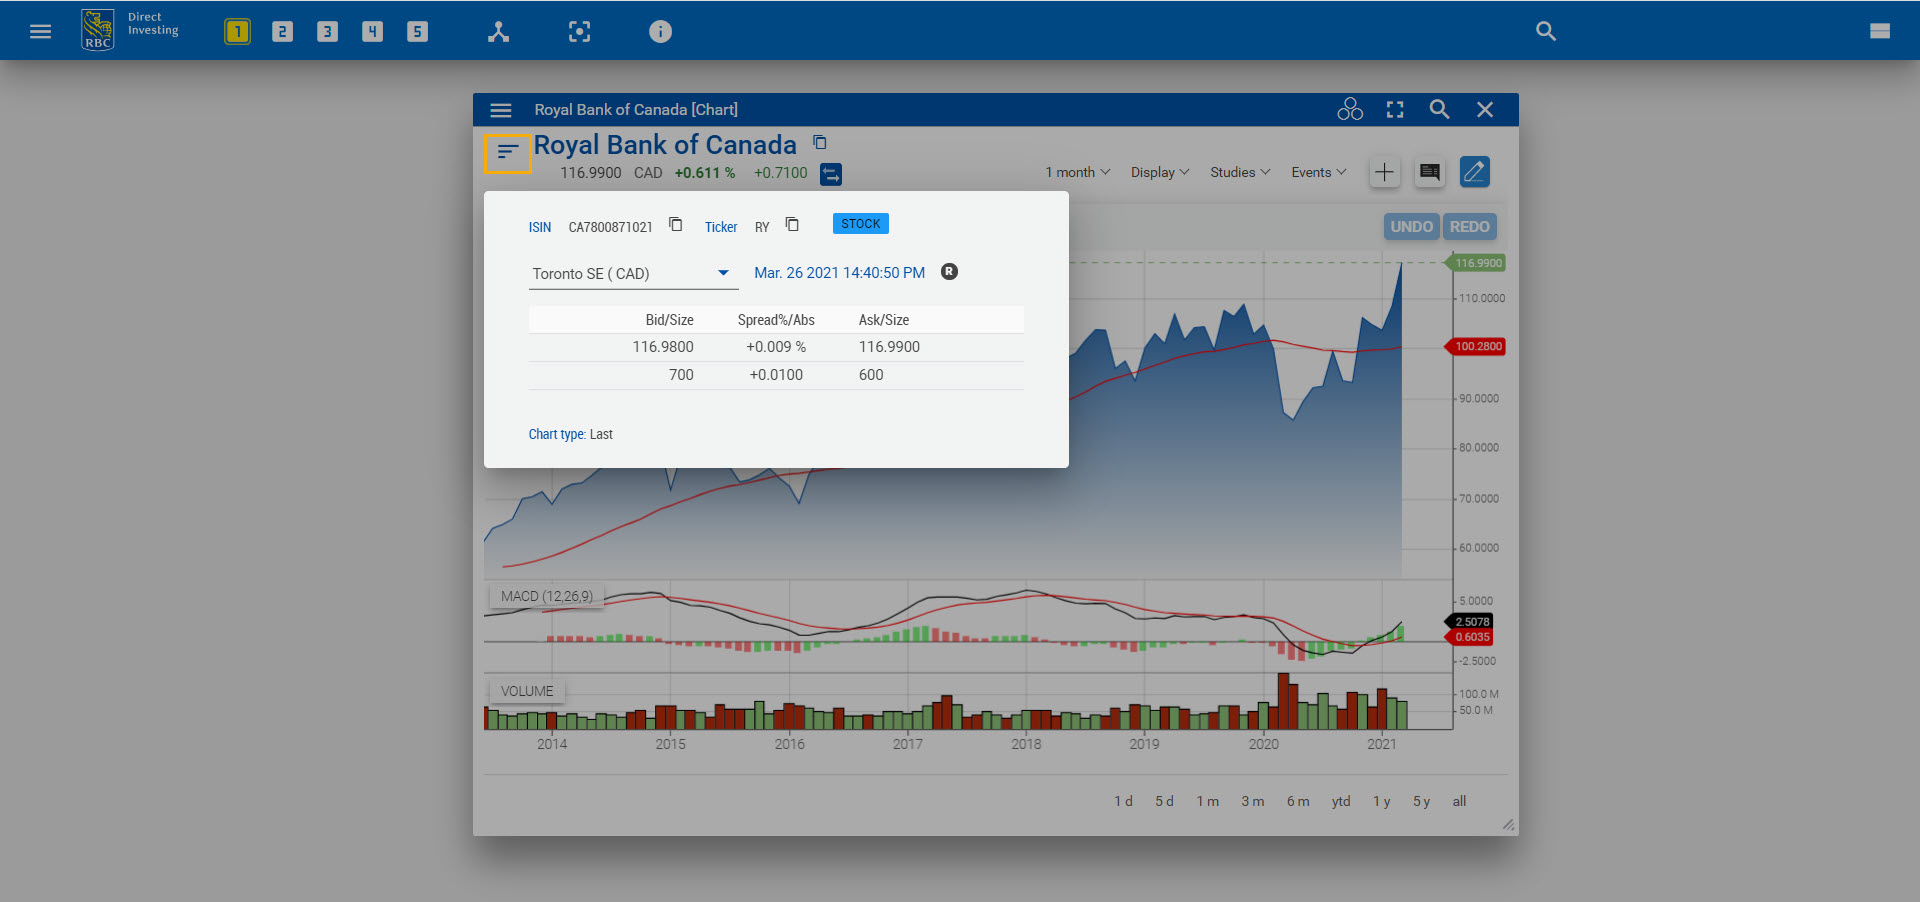
It includes base data, the ability to change the market and bid/ask data and, for some asset classes, the data field.
RBC Direct Investing Inc. and Royal Bank of Canada are separate corporate entities which are affiliated. RBC Direct Investing Inc. is a wholly owned subsidiary of Royal Bank of Canada and is a Member of the Investment Industry Regulatory Organization of Canada and the Canadian Investor Protection Fund. Royal Bank of Canada and certain of its issuers are related to RBC Direct Investing Inc. RBC Direct Investing Inc. does not provide investment advice or recommendations regarding the purchase or sale of any securities. Investors are responsible for their own investment decisions. RBC Direct Investing is a business name used by RBC Direct Investing Inc. ® / ™ Trademark(s) of Royal Bank of Canada. RBC and Royal Bank are registered trademarks of Royal Bank of Canada. Used under licence. © Royal Bank of Canada 2021.
Images presented in the image are for illustrative purposes and may not represent the actual web pages within the RBC Direct Investing online investing site.
The views and opinions expressed in this publication are for your general interest and do not necessarily reflect the views and opinions of RBC Direct Investing. Furthermore, the products, services and securities referred to in this publication are only available in Canada and other jurisdictions where they may be legally offered for sale. If you are not currently resident of Canada, you should not access the information available on the RBC Direct Investing website.
Inspired Investor brings you personal stories, timely information and expert insights to empower your investment decisions. Visit About Us to find out more.